Altmetrics: does our research actually make a difference?
Why altmetrics matter — and what they reveal about the real-world impact of our work
The altmetrics ‘doughnut’ and score for a recent Exercise for Science study. But what does it mean?
Our research aims to influence what people do — in clinics, in policy, and in everyday decisions about health.
Most research answers a question. The harder test is whether it changes anything. Since 2014, Exercise for Science has focused on that step: supporting research that moves from publication into practice. So how do you tell whether a study is actually making a difference?
One answer lies in altmetrics: measures of how research is picked up beyond academia — in news coverage, policy documents, clinical guidance and public discussion. Altmetrics don’t tell the whole story, but they do show whether research is reaching the places where decisions are made.
Seeing the difference
Traditionally, research influence has been measured through citations — how often one paper is referenced by another. But what about impacts beyond the academic world?
Some of these wider impacts are visible at system level. Research into joint implants has helped identify causes of failure, informing changes in regulation and improving patient safety — outcomes captured in UK Research Excellence Framework case studies.
But research impact is not only systemic: it is often personal and immediate. Our study of knee health in midlife offers an example. In adults with no symptoms or history of knee problems, more than 97% showed abnormalities on MRI. Rather than signalling risk, these findings suggest such changes are common — and often part of normal ageing. Seen in this context, MRI findings become less a warning and more a source of reassurance — helping people feel confident about starting or returning to exercise. This, in turn, supports wider public health efforts, including NHS initiatives such as Couch to 5K. Impact builds through system change, but also through clearer decisions made every day.
Explore the study: How common is kn:e damage among middle-aged non-runners?
How are we doing?
Earlier work from members of the Exercise for Science team established impact at system level. Research into joint implants helped identify causes of failure and contributed to changes in regulation and patient safety, as set out in published impact case studies: Making joint implants safer by identifying causes of previous failures and Hip replacements: changes to health policy and regulation.
Our recent work on exercise and joint health shows how this impact now extends into wider clinical and public discussion. Several Exercise for Science papers have achieved Altmetric scores above 500, indicating unusually high levels of engagement across multiple audiences. Scores above 100 reflect sustained attention from media, clinicians and policy stakeholders. These results provide clear evidence that Exercise for Science research is reaching beyond academic publication and contributing to real-world conversations about health.
Why it matters
Healthcare depends on evidence that is both robust and usable. Insight has to reach clinicians, patients and policymakers to make a difference. But there is also a more practical test. Research has to prove its value. In the UK, this happens through the Research Excellence Framework (REF) — a national assessment carried out roughly every six to seven years.
Universities are required to show not just what they have discovered, but what difference it has made. This includes formal impact case studies, supported by evidence such as policy influence, clinical adoption and, increasingly, altmetrics. This creates a clear expectation: research should be of use. Exercise for Science has been funded for more than 15 years. That continuity reflects work that contributes to real-world outcomes.
“Recent altmetric scores indicate our work is entering conversations where it can influence decisions and patient outcomes.”
Altmetrics do not prove impact on their own. But they do show whether research is reaching the places where impact becomes possible, helping answer the underlying question: does it make a difference.
Altmetrics explained: a quick guide
What does “altmetrics” mean?
“Altmetrics” = alternative metrics. The term was coined in 2010 to describe ways of measuring research attention beyond citations.
Who provides it?
Altmetrics are not a single standard. They are aggregated by providers such as Altmetric (Digital Science) and PlumX (Elsevier), using transparent methods to collect and weight attention data.
What do you see?
The most familiar output is the Altmetric Attention Score and its coloured “donut” badge.
The number = weighted attention score
The colours = sources (news, policy, social media, blogs)
Clicking through shows a dashboard with:
media coverage
policy and guideline mentions
social media activity
geographic spread
How is it calculated?
Sources are weighted differently: news carries more weight than a tweet; policy mentions are particularly significant.
How should it be read?
Altmetrics are an early indicator of reach and engagement. They do not prove impact, but show whether research is entering the channels where impact happens.
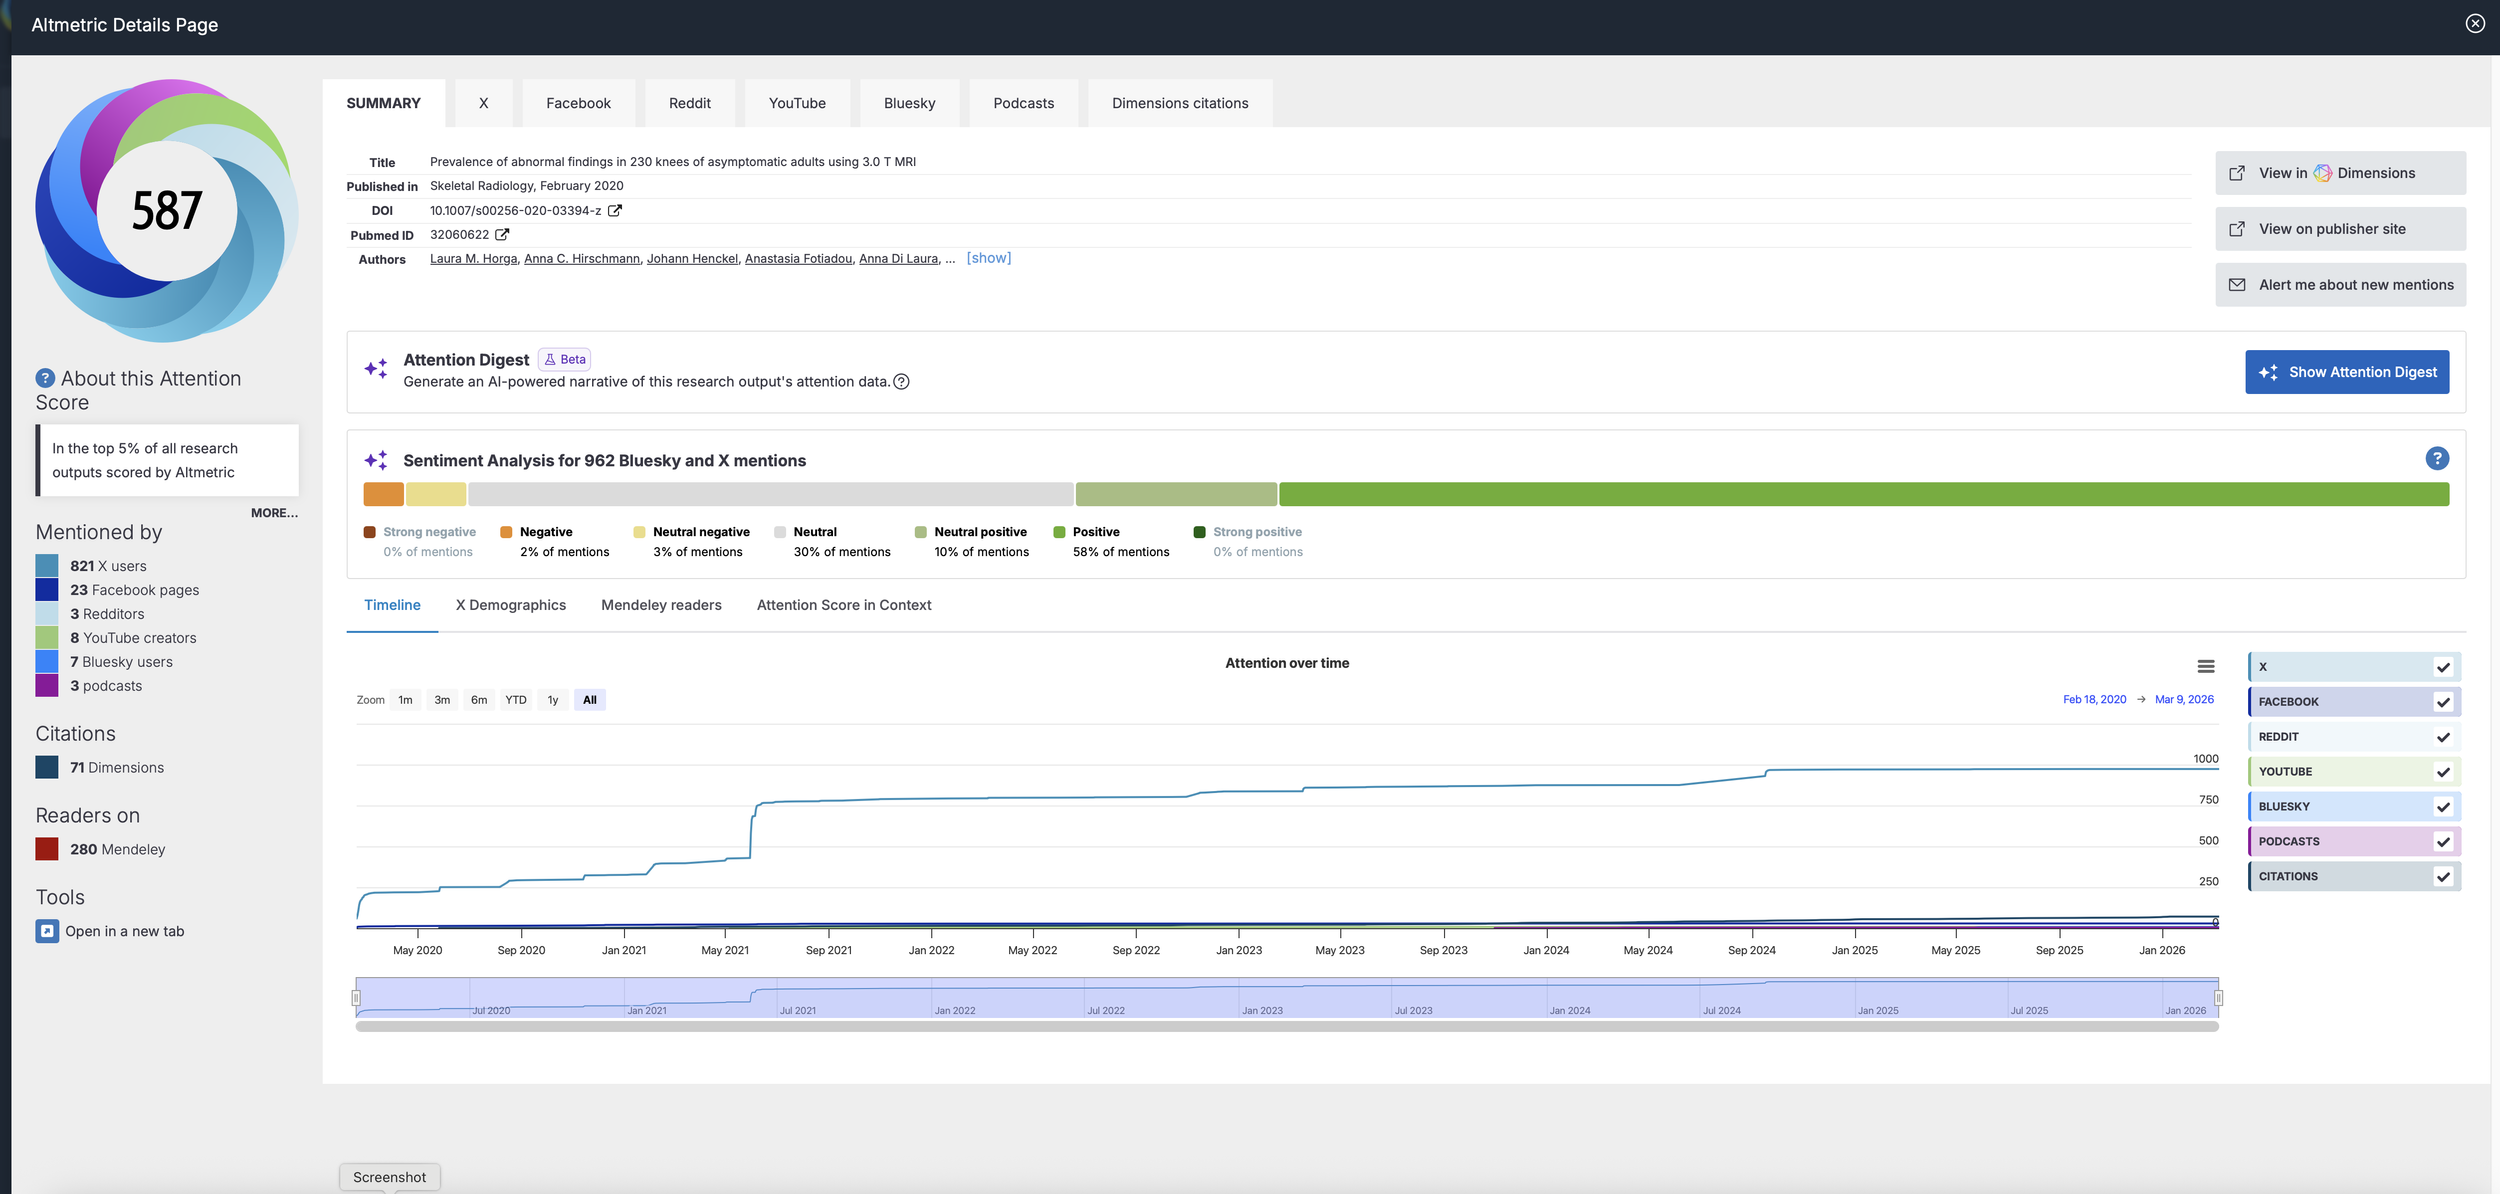
Atlmetrics dashboard showing some of the data for our 2020 study, Prevalence of abnormal findings in 230 knees of asymptomatic adults using 3.0 T MRI