
A new review from Exercise for Science researchers explores what fat within our muscles reveals about their condition.

Johnny Bravo has muscle size covered. Muscle quality needs a closer look.
Muscles can retain much of their size, but changes inside them can help explain declining strength and mobility.
We often associate bigger muscles with strength and fitness. Yet a muscle can stay much the same size while fat accumulates between its fibres, changing its composition in ways that outward appearances may not reveal. For researchers studying how we maintain strength and mobility throughout life, this raises an important question: how can we measure a muscle's condition, not just its size?
In a new review published in the Journal of Cachexia, Sarcopenia and Muscle, Christopher Spence, Martin Alberto Belzunce, Anna Di Laura, Johann Henckel and Alister Hart bring together evidence on intramuscular fat: how researchers measure it, what it reveals about muscle health, and what needs to happen before it can become a standard part of clinical assessment.
Looking inside the muscle
Ageing, inactivity, injury and disease can all contribute to fat accumulation within muscle. Across the studies reviewed, higher levels are associated with reduced strength, poorer mobility and a range of adverse health outcomes. Measuring composition adds information that could help researchers understand how muscles change with age, support joints and respond to exercise or rehabilitation.
Quantitative MRI can measure fat throughout individual muscles. AI tools now speed up the analysis, allowing researchers to compare larger groups and investigate differences previously impractical to study at scale.
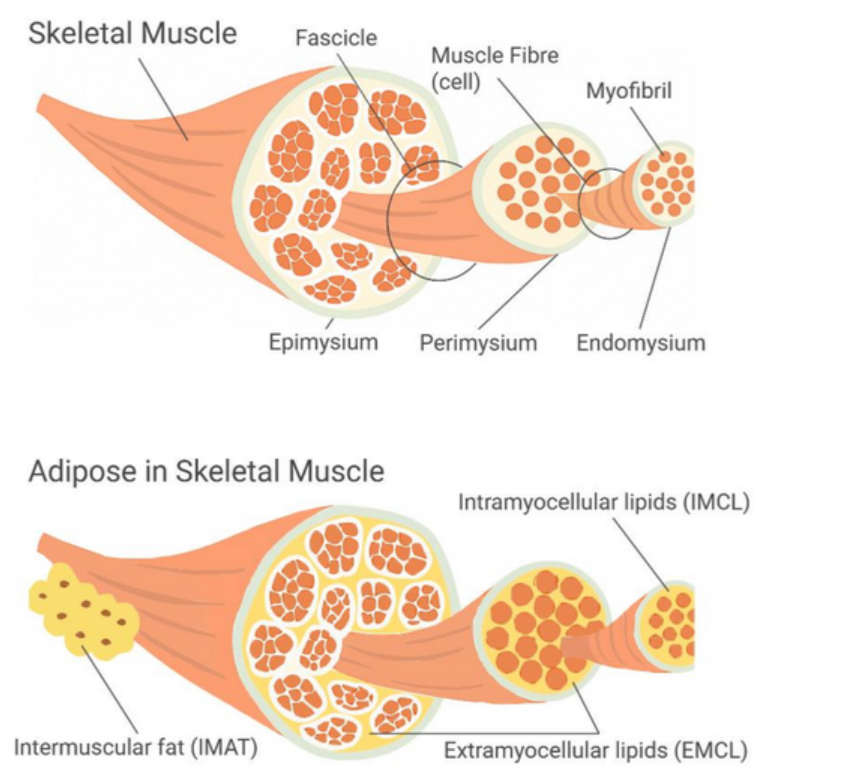
A closer look inside muscle: fat can sit within muscle cells or between fibres and muscle groups. Its location and biological role matter when interpreting muscle health. Christopher Spence (2026), created in BioRender; reproduced from Spence et al. (2026), Figure 2.
Understanding what the measurements mean
Interpreting muscle fat requires care. Endurance athletes store fat inside muscle cells as a readily available fuel and can remain metabolically healthy despite having substantial stores. Fat stored within these cells has a different role from fatty tissue accumulating between muscle fibres. The amount measured also varies by the muscle examined, age, sex, ethnicity and activity level.
The review therefore highlights a central challenge: which measurements indicate a problem, for whom, and under what circumstances? Researchers need to assess muscle fat alongside strength and physical performance.
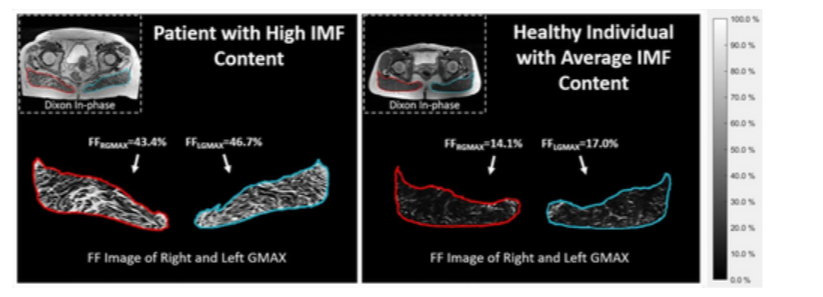
Looking beyond muscle size: these MRI maps show higher fat content in the buttock muscles of a patient with hip arthritis (left) than in a healthy, moderately active individual (right). Brighter areas indicate higher fat fractions. Belzunce et al. (2021), reproduced in Spence et al. (2026), Figure 5. CC BY.
Towards a useful clinical measure
The evidence also shows that muscle fat can change. Exercise programmes can help limit or reduce fatty infiltration, although responses vary between populations and interventions. This creates the prospect of tracking whether treatment improves muscle composition alongside changes in strength and mobility. Before clinicians can use these measurements routinely, researchers need consistent methods, robust reference ranges and clearer evidence of what constitutes a meaningful change.
The review builds on the team’s wider work to understand and measure muscle health. By connecting advances in imaging with evidence about muscle function, it helps define the next steps towards assessments that could guide care and support lifelong musculoskeletal health.
Read the review in the Journal of Cachexia, Sarcopenia and Muscle.
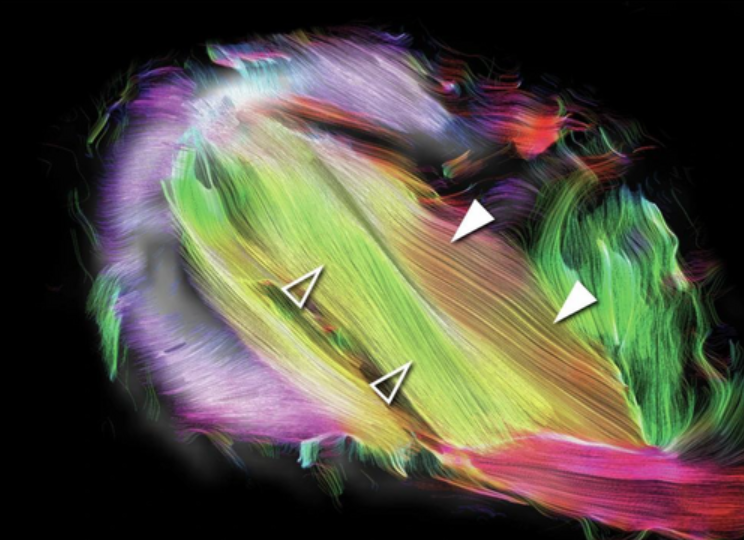
Muscle architecture in colour: advanced MRI traces the orientation of fibres in a healthy shoulder. The colours show fibre direction, illustrating another way researchers can explore muscle structure beneath the surface. Marth et al. (2024), reproduced in Spence et al. (2026), Figure 3. CC BY.